


In this article
What per-GB egress billing actually costs at scale, how 95th percentile bandwidth measurement works and where it came from, why your 95th percentile figure is not your average usage, a worked example comparing both models on the same workload, and how OpenMetal’s included allocation plus flat overage rate fits into the picture.
Most infrastructure teams know roughly what they pay for compute and storage. Egress is the line item that keeps surprising them. You transferred a known amount of data this month. But the bill doesn’t reflect that number. It reflects something else, something that isn’t explained clearly in your contract and wasn’t part of your architecture review. This article explains what’s actually being measured, why the two main billing models produce very different outcomes for the same workload, and how to figure out which one you’re on before it shows up on your invoice.
Why Egress Billing Catches Teams Off Guard
Ingress is free. Uploading data into a cloud provider’s infrastructure costs nothing. That asymmetry is intentional: it makes moving data in feel frictionless, while moving data out carries a cost that only becomes visible at scale.
Egress refers to data leaving a provider’s network. That includes delivering content to end users, sending data to another cloud or on-premises system, syncing with external services, or moving data between regions within the same provider.
Egress charges are the most criticized element of cloud pricing. A 2025 CloudZero analysis found that data transfer accounts for 6 to 12 percent of typical cloud bills, yet most teams can’t identify where their egress spend is concentrated. The charges are real but hard to see without deliberate analysis.
The problem is more than the cost, it’s the unpredictability. Teams budget for compute and storage, then discover that serving users, running backups, or exporting reports generates a line item they didn’t model.
How Does Per-GB Egress Billing Work?
Per-GB billing is the model used by the major hyperscalers. Every gigabyte that leaves their network is metered and charged at a per-unit rate.
AWS charges approximately $0.09 per GB, Azure approximately $0.087 per GB, and GCP approximately $0.12 per GB for the first terabyte. All three providers have reduced egress pricing in response to regulatory pressure, but rates remain significant at scale.
The math compounds quickly. Moving just 10 TB costs roughly $900 per month on the major hyperscalers. For data-heavy workloads, egress can become one of the largest line items on the bill.
Per-GB billing is easy to understand but difficult to predict. Every user request, every API response, every report export, and every backup restoration contributes to the meter. Teams serving variable traffic have no reliable way to forecast their egress cost at the start of a month because that cost is entirely dependent on demand they haven’t seen yet.
There are also hidden layers. In a microservices architecture with services distributed across availability zones, you pay $0.01 per GB each way for cross-AZ traffic, or $0.02 per GB for any data that crosses an AZ boundary, and this is per hop. In a busy microservices environment, cross-AZ traffic can easily cost $2,000 to $8,000 per month in charges that appear in billing under “EC2-Other” where most teams aren’t looking.
What is 95th Percentile Bandwidth Billing?
95th percentile billing is a different model entirely. Rather than counting every byte transferred, it measures your sustained bandwidth rate and bills you on near-peak usage.
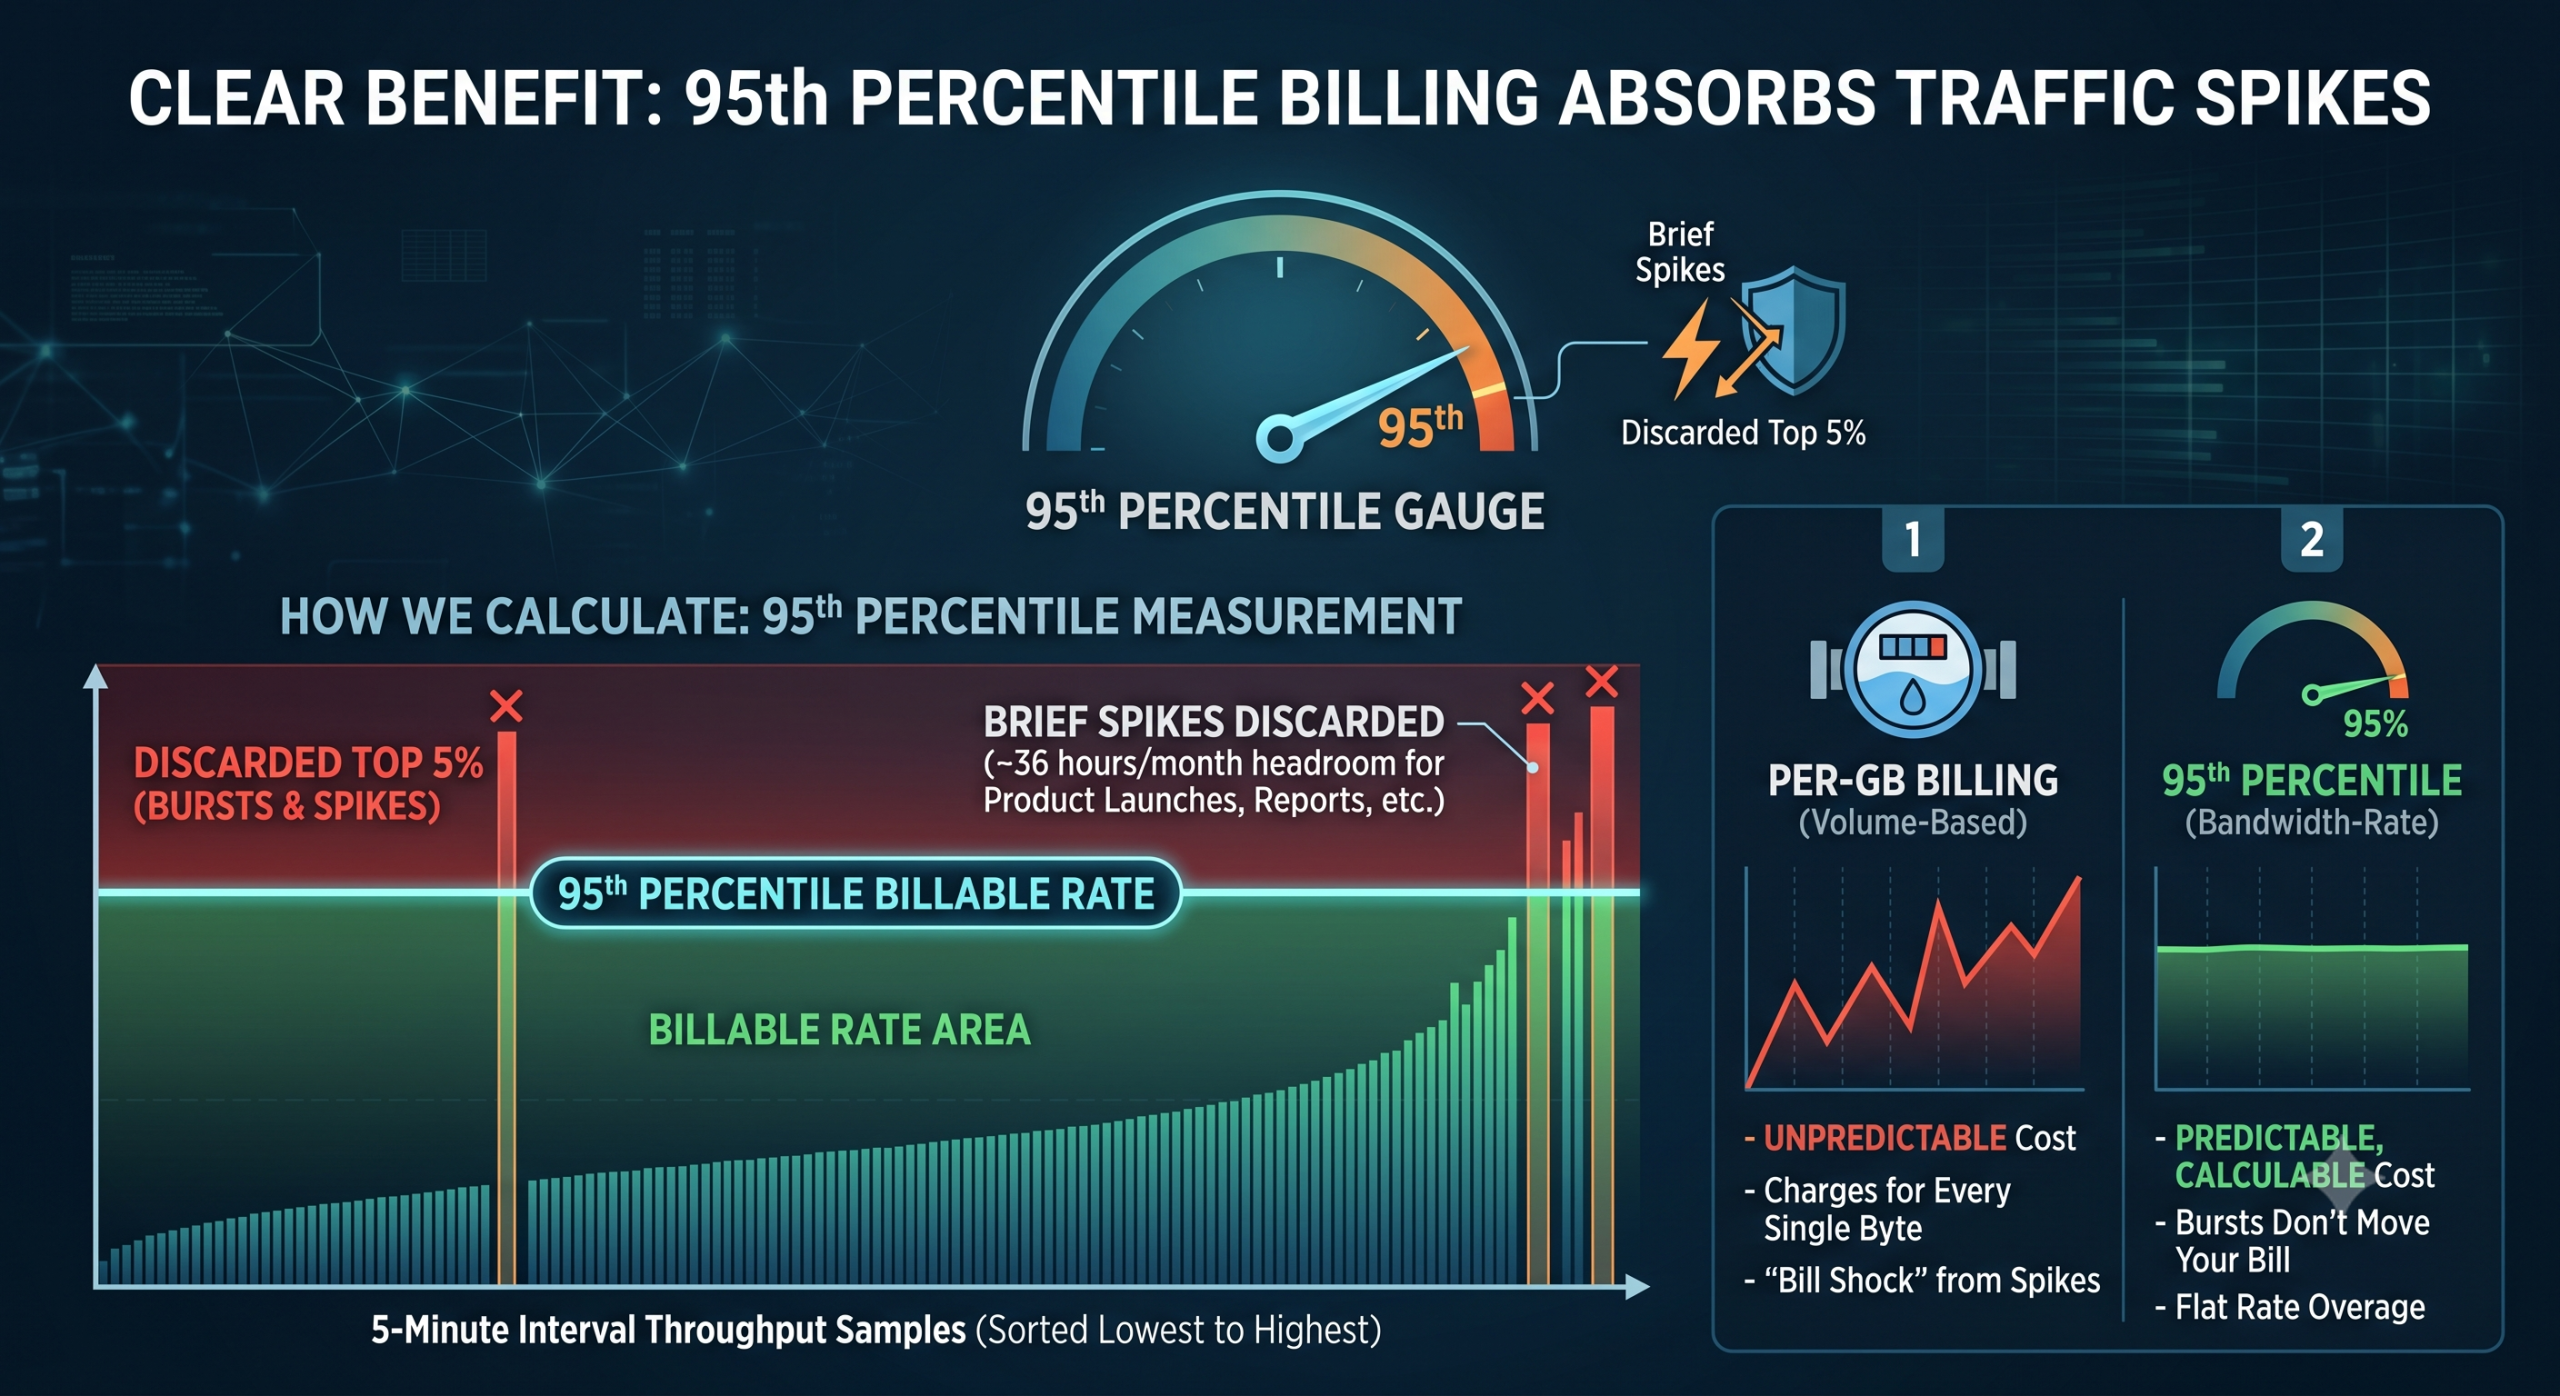
The 95th percentile billing method works as follows: bandwidth usage is sampled at regular intervals (commonly every 5 minutes) throughout the billing period. All collected measurements are sorted in ascending order. The top 5 percent of measurements are discarded. The next highest remaining value becomes your billable bandwidth rate.
It is the sustained rate of data transfer that costs a provider money. The sum of the 95th percentile usage of all of a provider’s customers predicts the peak backbone traffic that the provider must provision for. The model originated in the ISP and colocation world, and it was designed to be fair to customers with traffic that isn’t perfectly uniform.
The practical benefit: brief traffic spikes don’t affect your bill. If a customer normally uses 1 to 2 megabits per day but downloads a large file that consumes 5 or more megabits for 15 minutes every Friday, those 15 minutes would be discarded because they fall in the top 5 percent of measurements. The customer is billed at their 95th percentile rate, not their peak.
The top 5 percent of a monthly billing period represents roughly 36 hours. That’s enough headroom to absorb product launches, end-of-month reporting spikes, batch jobs, and other predictable traffic events without triggering overage charges.
Why Your 95th Percentile Figure is Not Your Average Usage
This is the part most teams miss when switching from per-GB billing to 95th percentile. The number you’re billed on is not your average throughput. It’s your near-peak throughput, and those are very different values for most real workloads.
Consider a SaaS application with typical traffic behavior: moderate baseline usage during business hours, a spike during evening hours when users run end-of-day exports, and a larger weekly spike on Fridays when automated reports are generated and delivered.
Scenario: the application runs at roughly 1 Gbps through most of the day. Evening usage pushes it to 3 Gbps. Friday batch jobs push it to 6 Gbps for several hours each week.
If we count total GB transferred, the daily average throughput might look moderate. But sorting all the 5-minute interval samples and dropping the top 5 percent removes those Friday peaks and the worst of the evening spikes. The 95th percentile value lands somewhere around 2.5 to 3 Gbps: well above the daytime baseline, much lower than the Friday peak, and a number that has no direct relationship to total GB transferred.
This is why the model is both favorable and sometimes counterintuitive. A workload that runs at low throughput most of the month but has a few sustained high-traffic periods will have a 95th percentile close to those high-traffic levels, not close to the average. Burstable billing protects against isolated spikes but not against patterns of recurring elevated traffic.
The workloads that benefit most from 95th percentile billing are those with:
Predictable traffic spikes shorter than 36 hours per month. Product launches, planned marketing events, and weekly batch jobs all fall within this window if they’re short enough. The spikes are discarded from the calculation entirely.
High burst-to-baseline ratios. A workload that regularly hits 10x its baseline throughput during peak periods pays on a 95th percentile value much lower than its peak, whereas per-GB billing would charge for every byte during those peaks.
Consistent but moderate sustained traffic. Applications that run at steady moderate throughput without extreme spikes have predictable 95th percentile values and therefore predictable bills.
How OpenMetal’s Egress Model Works
OpenMetal uses 95th percentile billing for egress overage, with a flat included allocation per server tier that aggregates across a cluster.
Each server tier includes a baseline egress allocation. For a three-server cluster, those allocations combine: if each server includes a given amount, the cluster’s total included allocation is three times that amount. Traffic within the included allocation generates no overage charges regardless of usage pattern.
When usage exceeds the included allocation, overage is billed at $375 per Gbps using 95th percentile measurement. That figure covers approximately 180 TB of transfer. Critically, it’s a known rate. There’s no per-GB meter running in the background, no tiered rate table to calculate against, and no distinction between traffic types or destinations.
The 95th percentile calculation protects against bill shock from traffic spikes, provided the spike duration falls within the top 5 percent window. Traffic that pushes past the included allocation for a sustained period is what generates overage, not brief moments of high throughput.
Additional egress capacity can be purchased as needed if your workload consistently exceeds the included allocation.
Comparing the Models on the Same Workload
To make this concrete, here’s the same SaaS application run through both billing models.
The workload: A platform serving approximately 50,000 active users. Total monthly data transferred: roughly 120 TB. Traffic is uneven: low overnight, moderate during business hours, elevated evenings, and a large Friday spike from automated report generation.
Per-GB billing (using $0.09/GB as a placeholder, verify current rates before budgeting):
120 TB = 122,880 GB At $0.09/GB: approximately $11,060/month in egress alone, before compute or storage.
That figure moves in direct proportion to user growth, feature additions that increase data transfer, or any month with elevated traffic. It’s also hard to model in advance because total GB transferred depends on user behavior you can’t predict precisely.
95th percentile billing:
The 95th percentile for this traffic profile lands around 2.8 Gbps based on the usage pattern described above. If that falls within the included allocation for the cluster, the egress charge is zero. If it exceeds the allocation, the overage is calculated on the delta at $375/Gbps, a predictable, calculable number.
The honest caveat: per-GB billing can be cheaper for very low-volume, very consistent workloads. If you’re transferring a small, predictable amount of data every month with no traffic variation, the per-GB math may be simple. The 95th percentile model is most favorable for workloads with meaningful traffic variability, which describes most production applications with real user bases.
How to Estimate Your Own 95th Percentile
If you’re currently on per-GB billing and want to understand what your usage would look like under a 95th percentile model, the calculation is approachable.
Pull your network throughput metrics for the last 30 days at 5-minute granularity. Most monitoring tools (Datadog, Prometheus, CloudWatch) can produce this. Sort all the samples from lowest to highest. Drop the top 5 percent. The highest remaining value is your approximate 95th percentile.
Compare that number to the included allocation for the server configuration you’re evaluating. The gap between them, if any, is what you’d pay overage on.
When evaluating any provider, the questions to ask are: What is the included egress allocation per server? How does it aggregate for multi-server deployments? What is the overage rate and how is it measured? Is the 95th percentile window the full billing month? What traffic types count toward the calculation?
Egress billing is a solvable problem once you understand the model. The difficulty is that most architecture reviews happen before bandwidth billing becomes visible as a cost driver, and by the time teams start modeling it, they’re already mid-contract with a per-GB provider.
Frequently Asked Questions
What is 95th percentile bandwidth billing?
It’s a method of measuring bandwidth usage that samples your network throughput at regular intervals (typically every 5 minutes), discards the top 5 percent of measurements, and bills you based on the highest remaining sample. The effect is that brief traffic spikes are excluded from your bill, and you pay on your near-peak sustained throughput rather than your absolute peak or your total data transferred.
How is 95th percentile billing different from per-GB pricing?
Per-GB billing charges you for every gigabyte that leaves a provider’s network, with costs accumulating in proportion to total data transferred. 95th percentile billing charges based on your bandwidth rate rather than total volume, and excludes the top 5 percent of usage peaks from the calculation. The two models produce very different costs for the same workload depending on traffic shape.
When does 95th percentile billing save money compared to per-GB?
It tends to be favorable when your workload has high peak-to-baseline ratios and those peaks are short-lived (under about 36 hours per month total), when your total data transfer is high enough that per-GB rates produce significant costs, and when your sustained throughput is lower than your peak throughput. Very low-volume or perfectly flat workloads may not see a meaningful difference.
How do I calculate my 95th percentile bandwidth usage?
Pull 5-minute interval throughput metrics from your monitoring tool for a full billing period. Sort all measurements from lowest to highest. Remove the top 5 percent of values. The highest remaining measurement is your 95th percentile for that period. Most infrastructure monitoring platforms can generate percentile aggregations directly if you don’t want to run the calculation manually.
What is OpenMetal’s egress overage rate?
OpenMetal bills egress overage at $375 per Gbps using 95th percentile measurement. Each server tier includes a baseline egress allocation, and allocations aggregate across a cluster. For current per-server included allocations, see OpenMetal’s pricing page.
Does 95th percentile billing protect against traffic spikes completely?
It protects against spikes that fall within the top 5 percent of monthly measurements, which represents roughly 36 hours per month. A planned product launch, a weekly batch job, or a traffic event lasting a few hours won’t move your bill. A sustained traffic increase that persists across most of the billing period will, because it shifts the 95th percentile value upward.
OpenMetal provides dedicated private cloud and bare metal infrastructure with fixed-cost pricing and included egress allocations. Start a free trial or contact the team to discuss your workload.
Schedule a Consultation
Get a deeper assessment and discuss your unique requirements.
Read More on the OpenMetal Blog